Ultimate Guide to LinkedIn Engagement Analytics
Want to make your LinkedIn posts perform better? Understanding engagement analytics is the key. LinkedIn, with 1.1 billion members globally in 2026, offers massive opportunities for professional growth. But without tracking the right data, your efforts can fall flat. Here's what you need to know:
- Engagement actions include reactions, comments, shares, clicks, profile visits, and saves.
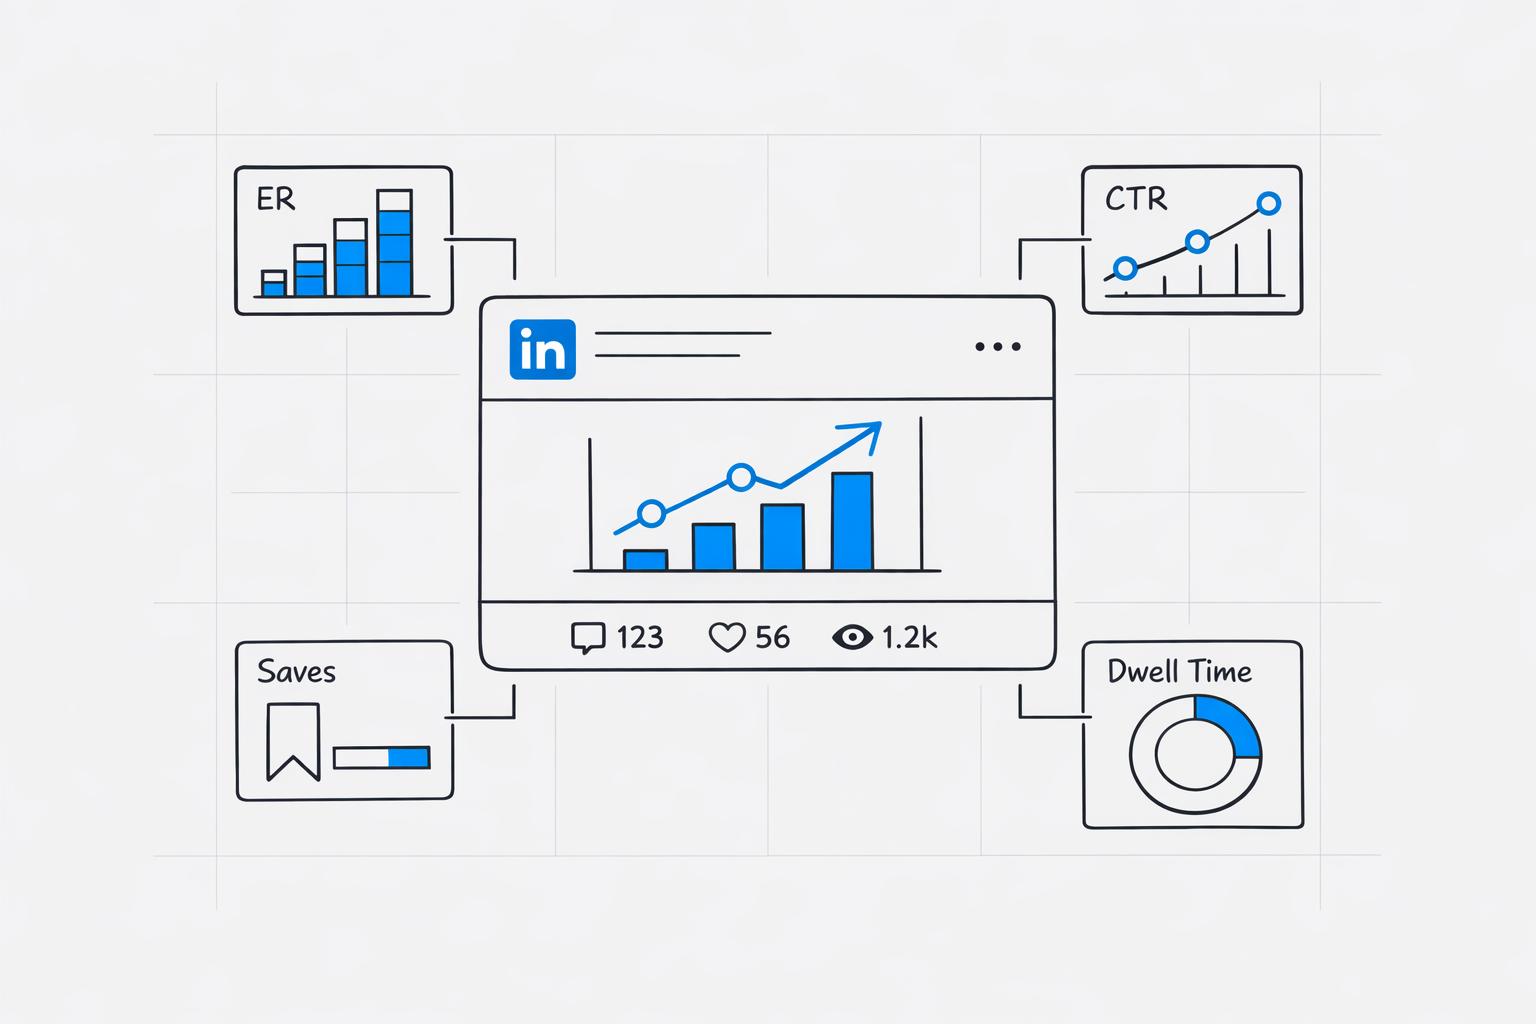
- Key metrics like Engagement Rate (ER), Save Rate, and Click-Through Rate (CTR) help measure content performance.
- Comments matter most: LinkedIn’s algorithm weighs comments 7x more than likes.
- Best practices: Use LinkedIn’s free analytics tools to track your post's reach, engagement, and audience demographics.
- Benchmarks: Average ER is 5.2%; aim for above 8% for elite performance. Personal profiles often outperform company pages.
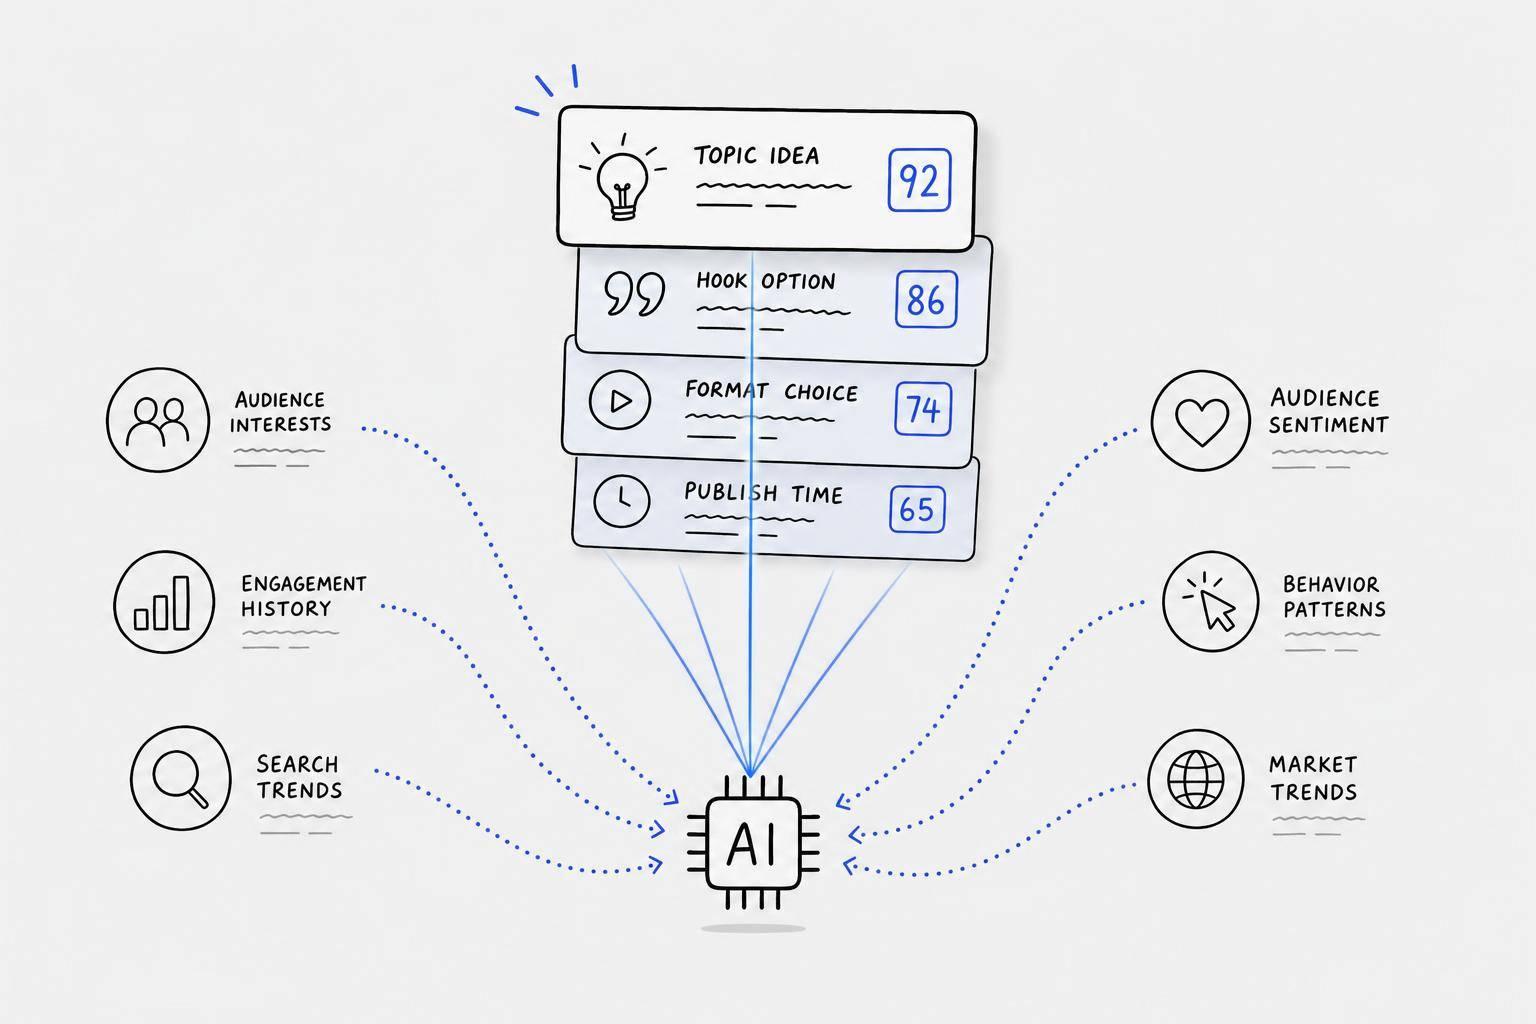
Pro Tip: Posts that get early engagement (first 60–120 minutes) are more likely to reach broader audiences. Use insights to tweak hooks, formats, or timing for better results.
Keep reading for actionable tips on using LinkedIn analytics to boost your content strategy.
Key LinkedIn Engagement Metrics
Core Engagement Metrics Explained
Impressions represent every time your post shows up in someone's feed, even if the same person sees it multiple times. On the other hand, Reach (or Unique Impressions) refers to the number of distinct viewers who encountered your post. When evaluating performance, reach is generally more dependable since impressions can sometimes paint an inflated picture.
To gauge how well your content connects with your audience, the engagement rate (ER) is key. Meanwhile, click-through rate (CTR) measures how effectively your calls-to-action drive clicks, and follower growth rate tracks how many viewers become consistent followers. Another important factor is dwell time - users spending 11–30+ seconds on your post indicates strong engagement, which can lead LinkedIn to expand the post's reach.
It’s also worth noting that not all engagements are created equal. Comments hold the most weight in LinkedIn’s algorithm - about seven times more impactful than a simple reaction. Shares and saves follow next, with likes ranking at the bottom.
"A post with 5 thoughtful, multi-sentence comments is outperforming one with 15 'great post!' replies, even if the raw numbers disagree." - Pollen
How to Calculate Engagement Rate
Understanding these metrics is crucial for calculating engagement rate effectively.
The widely accepted formula is:
Engagement Rate = (Reactions + Comments + Shares + Clicks) ÷ Impressions × 100
For example, if a post has 850 impressions and 30 engagements (12 reactions, 5 comments, 3 shares, and 10 clicks), the ER would be (30 ÷ 850) × 100 = 3.5%.
Some tools calculate ER using follower count instead of impressions, but this method is less accurate. It assumes all followers see your posts, which isn’t the case. Using impressions gives a clearer picture of how your content performs with the audience that actually sees it.
"Your LinkedIn engagement rate is most accurate and meaningful when it's calculated based on the number of impressions, not follower count." - Sprout Social
Other formulas can provide additional insights:
- Save Rate = (Saves ÷ Impressions) × 100
- CTR = (Link Clicks ÷ Impressions) × 100
A high Save Rate suggests your content has lasting value, as users save it for later reference.
With a solid understanding of ER, let’s explore what constitutes good performance on LinkedIn.
What is a Good Engagement Rate on LinkedIn?
Here’s a breakdown of LinkedIn engagement rate benchmarks based on the latest data. As of 2026, the platform-wide average ER is 5.20%, with a median of 4.7% in Q1 2026:
| Performance Tier | Engagement Rate |
|---|---|
| Below average | Under 2% |
| Average to strong | 2%–5% |
| Strong to excellent | Above 5% |
| Elite | Above 8% |
The type of content you post significantly affects engagement. Native document carousels, for example, lead the pack with an average ER of 7.00%, while text-only posts typically range from 3.60%–4.50%. Carousels tend to perform better because they increase dwell time.
Your account type also plays a role. Personal profiles generally see higher engagement rates, averaging 5–8%, compared to company pages, which usually fall between 1–2%. Company size can further influence these numbers. For instance, a tech startup with fewer than 50 employees might achieve a top-10% ER of 37.9%, while a tech firm with 1,001–5,000 employees typically sees a top-10% benchmark of 15.2%.
"The 1,001–5,000 [employee] band is the most misread in this sector. A technology company in that cohort running at 8–10% engagement is not underperforming. They are in the second quartile." - Colin Day, Oktopost
Using LinkedIn Analytics to Diagnose Content Performance
Identifying High- and Low-Performing Posts
Impression counts can be tricky - they don’t always tell the full story. A post with high impressions might not have the engagement to back it up. To get a clearer picture, compare metrics like Engagement and Save Rates across your posts. This will help you figure out which formats, topics, or hooks are actually prompting your audience to take action.
Once you’ve organized your posts by these metrics, look for patterns instead of focusing on one-off successes. Do your top-performing posts share a format like carousels, text-only updates, or native videos? Or do they revolve around certain topics or posting times? Set aside 15 minutes every Friday to review your last 10 posts by engagement rate. Identify the weakest one, pick a single element to tweak - such as the hook, timing, or format - and test that change the following week.
"If a metric can't change your next draft (hook, proof, timing, CTA), de‑prioritize it." - David Kim, LinkedIn Analytics Specialist
Next, let’s break down how specific metric patterns can reveal performance issues.
Reading Metric Patterns to Fix Performance Issues
Certain metric combinations can highlight specific problems with your content. For instance, if a post has high impressions but low engagement, it might mean your hook caught attention, but the content didn’t deliver - or your audience is too broad. On the other hand, high saves but low reach suggest your content has value, but the opening lines might not be strong enough to drive shares or wider visibility.
Here’s a quick guide to common metric issues and how to address them:
| Metric Pattern | Likely Problem | Recommended Fix |
|---|---|---|
| High Impressions / Low Engagement | Content is too generic | Make it more specific; refine the hook |
| Low Reach / High Saves | Weak hook or poor timing | Rewrite the opening lines; post during peak hours |
| High Reactions / Low Comments | Content is too agreeable | End with a question that invites personal input |
| High Impressions / Low Profile Views | Weak headline or profile picture | A/B test a clearer headline |
| Wrong Seniority in Demographics | Content complexity mismatch | Adjust depth or focus to match audience needs |
Another key metric to watch is engagement velocity - how quickly people interact with your post in the first 60–120 minutes. LinkedIn uses this early activity to decide whether to expand your post’s reach to a broader audience.
"A post earning Long Dwell early (in the first 60–90 minute initial-audience test) gets pushed to 2nd and 3rd-degree connections." - Paul Irolla, Founder & CEO, Meet Lea
Using Audience Demographics Data
Beyond engagement stats, understanding who is engaging with your content is just as important. LinkedIn’s Audience Demographics tool lets you filter your viewers and profile visitors by job title, seniority, industry, company size, and location. This helps you see if your content is resonating with your Ideal Customer Profile (ICP).
For example, if your goal is to reach VP-level decision-makers but most of your viewers are entry-level professionals, your content might be too basic. How-to posts often attract practitioners, while strategic discussions are more likely to engage senior leaders. Adjusting your tone, topics, and vocabulary can help realign your content with the audience you want to reach. A weekly review of your demographics - comparing your actual audience to your target audience - can catch misalignments before they become larger issues.
It’s also worth noting that different industries respond to different formats. For example:
- Marketing & Advertising audiences often prefer carousels.
- Finance & Banking professionals engage more with data-heavy research.
- HR & Recruiting audiences connect best with personal stories.
Linkedin Analytics DEEP DIVE (tutorial for beginners!)
sbb-itb-9f5fe42
How to Improve Your Content Strategy with Engagement Data
You can fine-tune your content strategy by tapping into engagement data and using it to make smarter, more informed decisions.
Refining Content Based on Analytics
Once you've identified your top-performing posts, take a closer look at what makes them stand out. Review their engagement rates over the last 30 days and look for patterns - whether it's the way you craft your hooks, the topics you cover, or the formats you use.
Format plays a big role. For example, document posts (carousels) on LinkedIn reach 1.39 times more people than standard posts and are saved 2.6 times more often. If a text post generates a high number of saves, it might be worth reworking it as a carousel to increase its reach. This tells you that your audience values the content and wants to revisit it.
Another key metric to watch is comment depth, not just the number of comments. LinkedIn's algorithm values thoughtful, multi-sentence comments about 15 times more than a simple "like". If your posts are getting plenty of reactions but mostly surface-level comments, consider ending your next post with a specific, engaging question. Posts that close with a direct question tend to generate 40–60% more comments than those that end in a statement.
Testing Content Variations
To improve your LinkedIn performance, try testing one element at a time. For instance, you could experiment with different hooks on otherwise identical posts or convert a text post into a carousel on the same topic. Publish these variations on different days but at the same time, and compare their engagement rates - rather than impressions - after 72 hours.
Here are a few practical tips for running these tests:
- Test each variant multiple times. Run 4–6 posts per variant to ensure your results aren't skewed by LinkedIn's algorithmic fluctuations.
- Don't compare apples to oranges. Since LinkedIn treats carousels and text posts differently, analyze their engagement rates separately.
- Mix up your formats. Alternating between formats can lead to 37% more follower growth compared to sticking with just one.
Another variable to experiment with is post length. Posts with over 1,000 characters tend to reach 1.18 times more people than shorter ones.
"The businesses winning on LinkedIn in 2026 are not the ones posting most frequently... They are the ones whose analytics feedback loop is tight enough to tell them exactly what is working." - Konnector.ai
These experiments help you turn analytics into actionable strategies.
Using Draft AI to Act on LinkedIn Insights
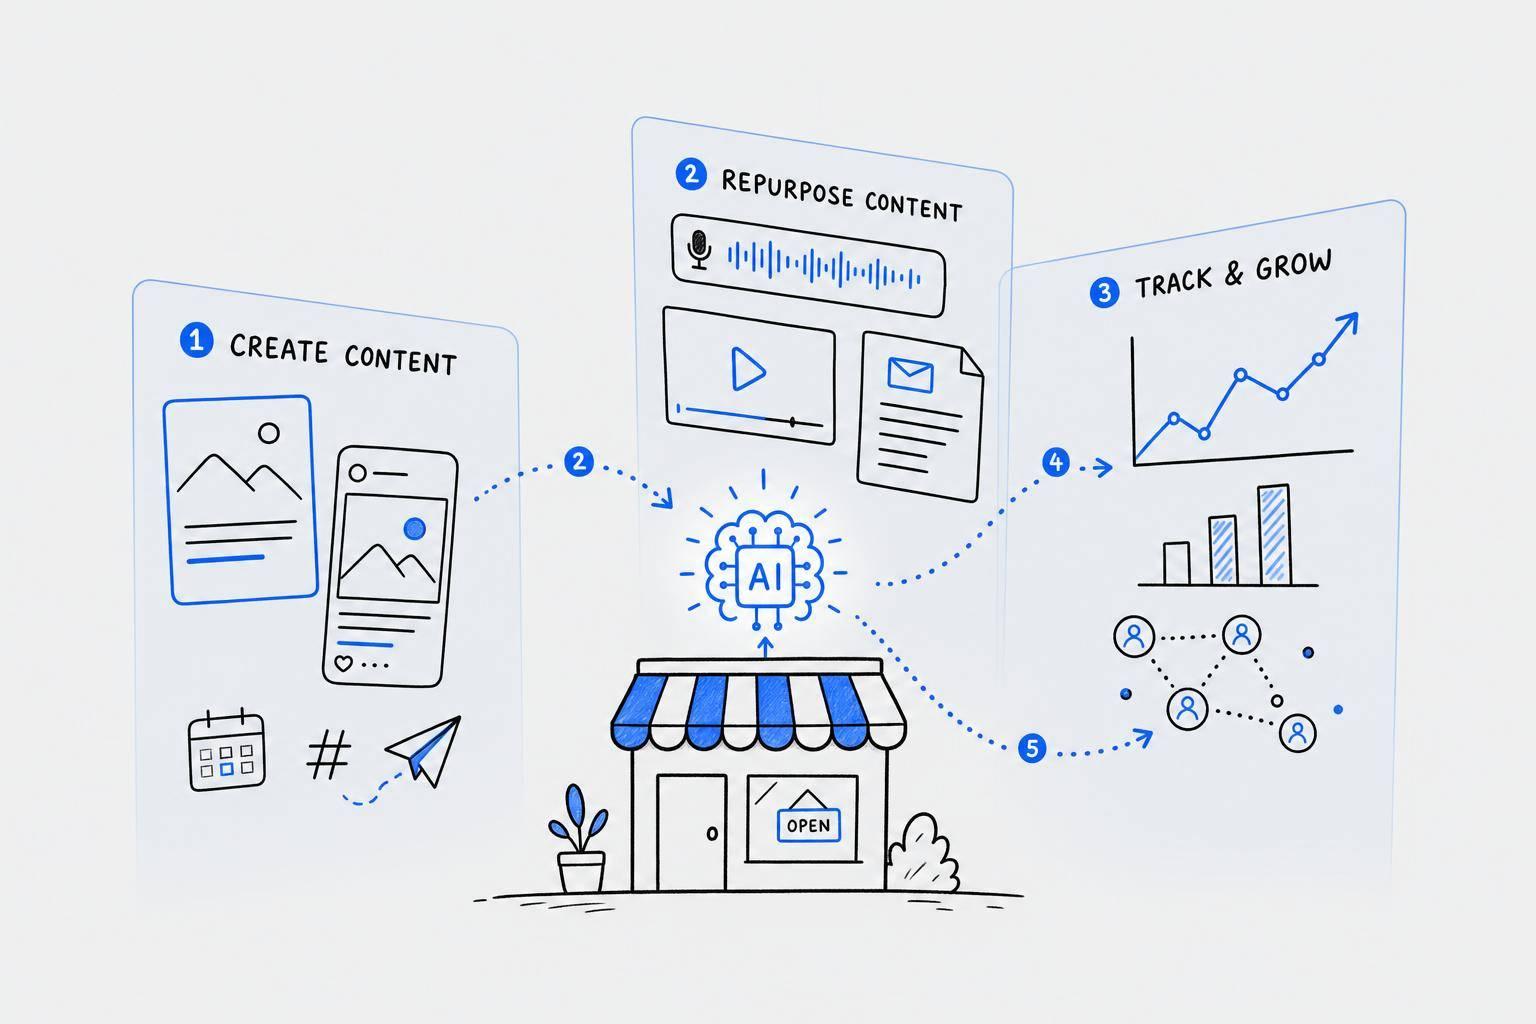
Once you've tested and validated changes to your content, tools like Draft AI can help you quickly implement those insights. Instead of manually reworking your content, Draft AI allows you to input your findings and generate ready-to-publish posts, carousels, or scripts tailored to your audience's preferences.
For example, if your data shows that checklist-style carousels consistently perform well, you can share this insight with Draft AI. In minutes, it will create a polished carousel complete with hooks, structured slides, and a closing question designed to spark engagement. The tool also ensures the content aligns with your tone and style.
Draft AI's content idea generator is another handy feature. By providing your niche or topic, you can receive a list of content ideas with engaging hooks, ready for review and use. For LinkedIn creators looking to close the gap between insights and execution, this streamlined approach is a game-changer.
Advanced LinkedIn Engagement Analysis
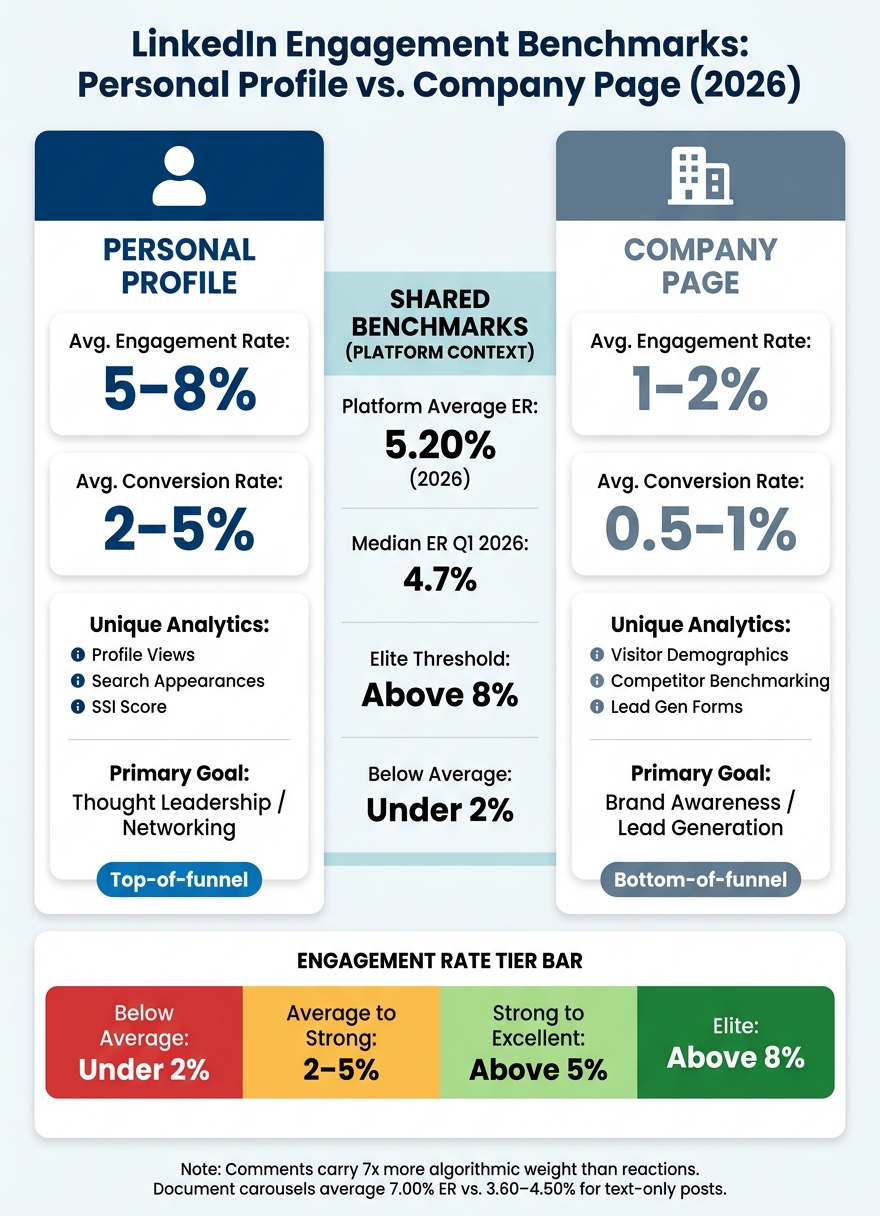
LinkedIn Engagement Rate Benchmarks: Personal Profile vs. Company Page (2026)
Building Custom Engagement Dashboards
LinkedIn's native analytics come with a major limitation: data retention is capped at 90 to 365 days, depending on the metric. If you want to track performance over a longer period, you'll need to export your data. You can do this directly from the Analytics tab on your Company Page or Personal Profile using the Export button, which provides an XLS spreadsheet. Once you have the data, you can build a custom dashboard to track key metrics. Include columns like Date, Post Title, Content Pillar, Format, Time Slot, and metrics such as Impressions, Reactions, Comments, Reposts, Saves, Link Clicks, along with ER (Engagement Rate), Save Rate, and CTR (Click-Through Rate). Use the formulas outlined earlier in this guide for these calculations.
"Individual posts are noise. Your monthly average is signal." - Alex Berman, LinkedIn Outreach Specialist
The real value lies in consistent monitoring. By sorting posts based on ER % and Save Rate %, identifying the top-performing formats, and testing one specific adjustment each week, you can uncover actionable insights without overcomplicating the process. With your dashboard in place, grouping data can help you identify trends and refine your content strategy.
Campaign and Cohort Analysis
Analyzing your posts by Content Pillar or Theme allows for deeper insights into performance trends. Instead of asking, "How did this post do?" you can evaluate, "How does my leadership advice content compare to my industry news content?"
This method often reveals patterns you might otherwise miss. For instance, you might discover that posts under one theme consistently drive high profile views but low website traffic, while another theme performs the opposite role. Knowing this helps you align each content type with specific stages of your funnel. Since LinkedIn's native analytics don't support this level of grouping, you'll need to rely on your exported spreadsheet or a third-party tool to conduct this analysis.
Another key metric to track is engagement velocity - how quickly a post garners reactions and comments in the first 120 minutes. A strong start signals LinkedIn’s algorithm to push the post to 2nd and 3rd-degree connections, significantly boosting its reach.
Personal Profile vs. Company Page Metrics
To refine your strategy further, it’s crucial to understand the differences between personal profile and company page metrics. Each serves a unique purpose and performs differently. Personal profiles typically see 5–8% engagement rates and 2–5% conversion rates, whereas company pages average 1–2% engagement and 0.5–1% conversion.
| Metric | Personal Profile | Company Page |
|---|---|---|
| Avg. Engagement Rate | 5–8% | 1–2% |
| Avg. Conversion Rate | 2–5% | 0.5–1% |
| Unique Analytics | Profile Views, Search Appearances, SSI Score | Visitor Demographics, Competitor Benchmarking, Lead Gen Forms |
| Primary Goal | Thought Leadership / Networking | Brand Awareness / Lead Generation |
Personal profiles are ideal for top-of-funnel activities like thought leadership and networking, while company pages are better suited for bottom-of-funnel actions such as Lead Gen Forms and custom button clicks. For example, if a personal post has high impressions but few profile visits, it’s being seen but isn’t compelling enough to drive curiosity about the author. On the other hand, if a company page post has good reach but a low CTR, it might indicate a mismatch between the offer and audience needs.
"A person's voice on a personal profile starts the race with a higher baseline than the company page can. If your only KPI is the company page rate, you're optimizing the harder surface." - Contentio
For personal profiles, Search Appearances is a key metric to watch. If you're not appearing for the right keywords, it’s time to revisit your LinkedIn headline and "About" section. For company pages, the Competitor Analytics feature allows you to compare your follower growth and organic engagement with up to nine competitors. This benchmarking adds valuable context to your raw data, helping you understand where you stand in your industry.
Conclusion: Key Takeaways for LinkedIn Engagement Analytics
Think of LinkedIn analytics as a feedback loop rather than a final grade. The main takeaway here is straightforward: focus on meaningful metrics over surface-level ones. Since 2023, post impressions have dropped by 63–66%, but engagement has climbed by 12–39%. This shift shows LinkedIn is prioritizing content that genuinely connects with its audience, rather than just attracting fleeting views.
The most impactful metrics to track are Engagement Rate, Save Rate, dwell time, and comments. Comments carry the most weight in LinkedIn's algorithm, saves indicate your content's lasting value, and dwell time helps determine whether LinkedIn will amplify your post. A quick 15-minute review each week of your ER% and Save Rate can highlight what's working and point to one specific adjustment for the following week.
"Tracking metrics without benchmarks is like checking your speed without knowing the limit." - Ivana Todorović, AuthoredUp
Beyond the numbers, it’s essential to understand who you’re reaching. Regularly reviewing audience demographics ensures your content is resonating with the right people - those who align with your goals - not just racking up views from outside your target audience. Adjust your approach accordingly: use personal profiles to establish thought leadership and company pages for driving leads.
Metrics only matter when they lead to action. Once you’ve identified which content themes, formats, and hooks work best, tools like Draft AI can help you quickly turn those insights into engaging LinkedIn posts, carousels, or hooks. To sum it up, as David Kim, a LinkedIn Analytics Specialist, explains:
"If you can't explain how a post helped the business in one sentence, your analytics are noise." - David Kim, LinkedIn Analytics Specialist
These strategies give you the tools to consistently refine your approach, aligning with the advanced analytics framework detailed in this guide.
FAQs
How do I know if my engagement rate is actually good?
Engagement rates can vary depending on your account type and the kind of content you post. Here's a general breakdown:
- 1–2%: This is considered average.
- 2–4%: A strong performance.
- 4%+: Exceptional engagement.
Personal profiles often achieve higher rates, typically around 5–8%, while company pages tend to hover between 1–2%. Instead of focusing solely on these benchmarks, pay close attention to your 4-week trends and key metrics like comments and saves. These can provide a better picture of how your audience is interacting with your content.
To improve performance, try using tools like Draft AI to craft customized content. Experiment with different formats to see what resonates most with your followers.
Why do my posts get impressions but no comments?
If your posts are getting impressions but no comments, it’s likely because they’re not sparking enough interest to drive interaction. This could be due to a few reasons: your hooks might not grab attention, your stance on a topic may be too vague, or you’re not encouraging conversation by asking specific questions.
Remember, LinkedIn prioritizes quality over sheer reach. Focus on delivering content that offers something meaningful. Tools like Draft AI can help you create attention-grabbing hooks and craft content that invites interaction. Also, make it a point to respond to comments quickly - this not only fosters a sense of community but also increases your post’s visibility.
What should I track weekly to improve faster?
To see quick improvements on LinkedIn, focus on tracking specific weekly metrics that can shape your next content strategy. Key metrics include:
- Engagement rate: This shows how well your content resonates with your audience.
- Save rate: A great indicator of how useful your content is to your followers.
- CTR (Click-Through Rate): Helps measure the intent behind link clicks.
- Profile views per post: Reflects how effectively your content draws people to your profile.
- Lead signals: Tracks potential opportunities feeding into your pipeline.
Skip obsessing over raw impressions - they often provide little actionable insight. Instead, analyze your best and worst-performing posts, tweak a single variable (like the hook or format), and refine your approach. Tools like Draft AI can help generate fresh, tailored ideas to keep your content strategy sharp.